Today in How to Automate, we will learn how you can quickly set up an automated port scanning Flow with Shodan.
As employees work from different places, from home or moving around, keeping control of the networks and what is allowed to transit can get tricky. Attackers can benefit from badly configured public networks. One effective solution to these challenges is to leverage the power of automation and integrate it with powerful tools like Shodan, a search engine specifically designed to map and scan network devices, and Slack, the popular messaging platform that promotes seamless communication and collaboration among team members.
This article will walk you through an automation workflow that combines Shodan’s port scanning capabilities with Slack’s real-time notification features. This integration enables you to identify open ports on a set of public IPs, gather detailed information about protocols, devices, software, and versions, and instantly share the results with your IT and security teams on Slack. By adopting this automated approach, you can effectively monitor attack surfaces, identify potential vulnerabilities, and enhance overall security posture, all while streamlining communication and collaboration among your team.
To do so, we will orchestrate 2 third-party tools: Shodan and Slack. You can easily replace Shodan with Criminal IP and Slack with Teams or other Scanning and Communication Services.
The goal of automating port scanning in your organization
The primary objective behind automating port scanning is to implement a structured and recurring process that enables your organization to actively monitor the security of its network devices with minimal human intervention. To achieve this, you can define a specific set of IPs and schedule automated reports at regular intervals to perform port scanning and analyze the IP information using Shodan.
Once the automated analysis is completed using Shodan, a comprehensive report is generated that provides essential information about the exposed IPs and open ports, if any are detected. This report covers various aspects, including the IP address, the associated open ports, protocols, devices, encryption details, software, and version information.
The generated report can be automatically posted on a designated channel in Slack. With a detailed overview of your network’s attack surface, your IT and security teams can promptly address any potential risks or vulnerabilities.
Let’s have a sneak peek of the final Flow before getting our hands on the tutorial.
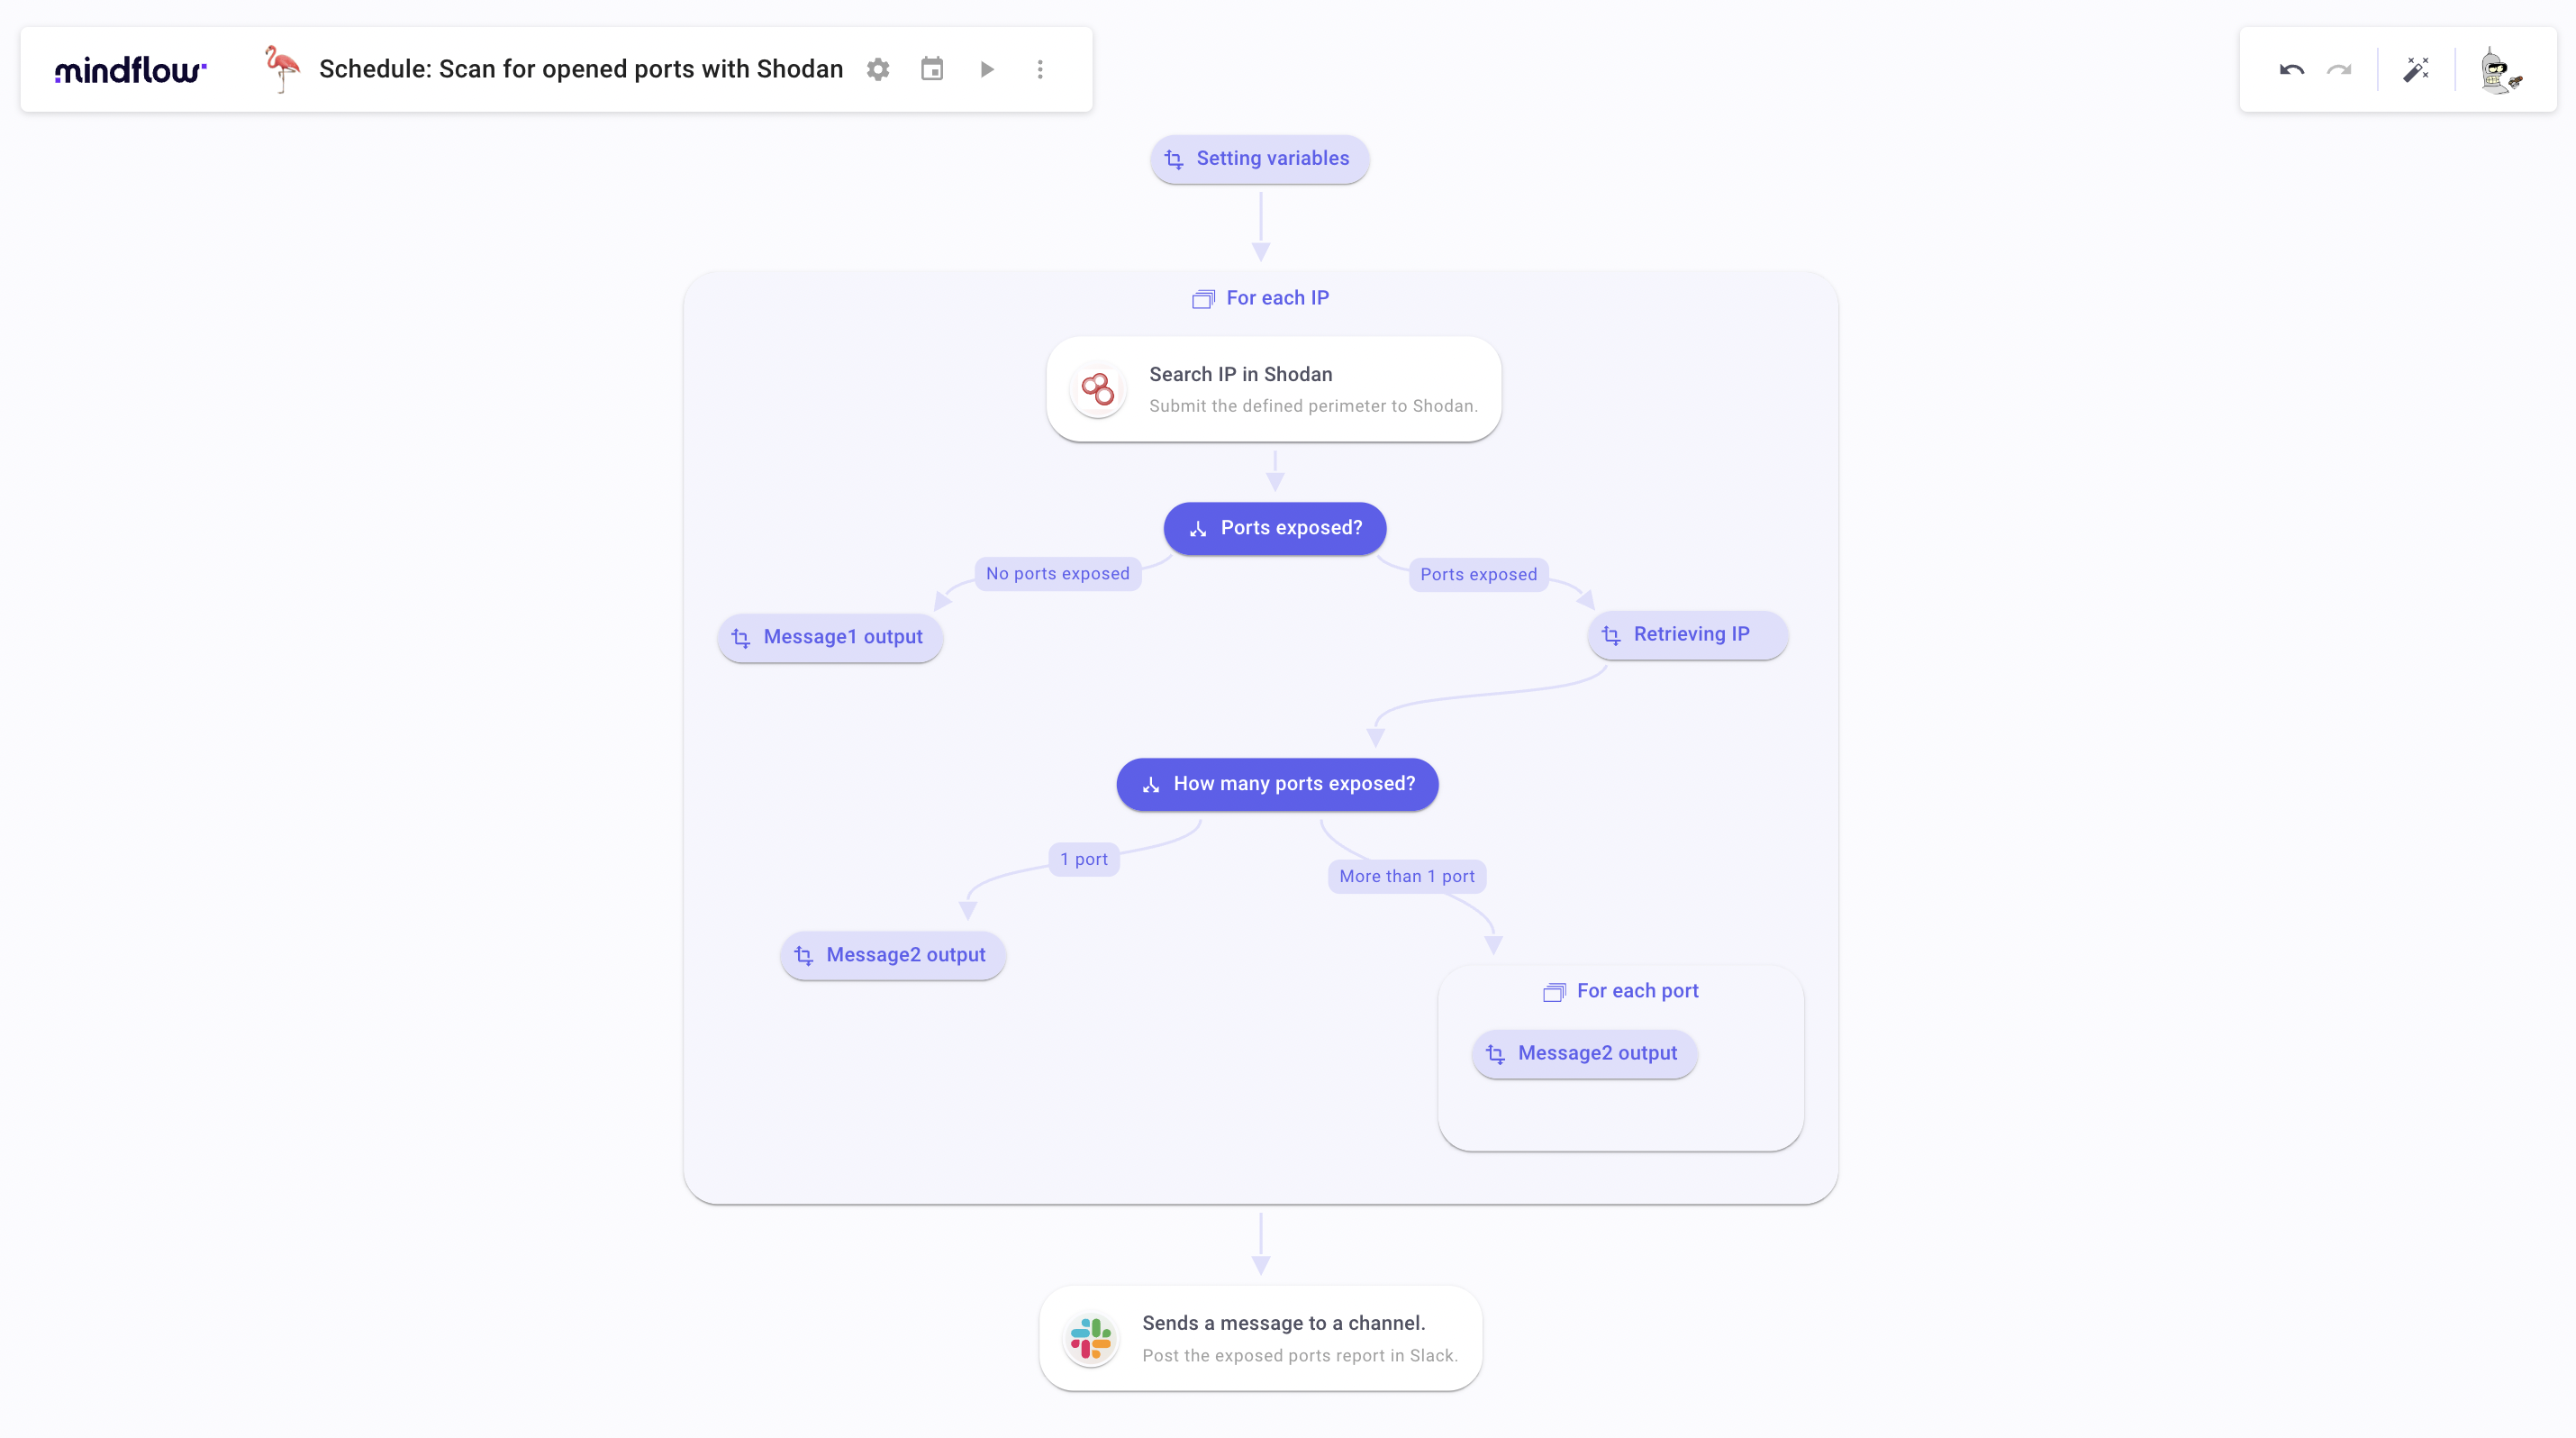
First steps: creating the Flow, setting up the scheduler and variables
As always, start by creating the Flow. Then name it with something cooler than “Schedule: Scan for opened ports with Shodan” if you want. After having named your Flow, there is, of course, the most critical task of this tutorial… Choosing the right emoji! This time, I chose the flamingo.
To set up the scheduler, click the “calendar” icon next to the Flow name on the upper left side of the window. Under “Schedule the playbook to run”, select “At regular intervals”. Then, select Weekly. Now, you must select the day and exact time to trigger the Flow. I chose Wednesday at 11:01 am.
Click on save. Your scheduler is set.

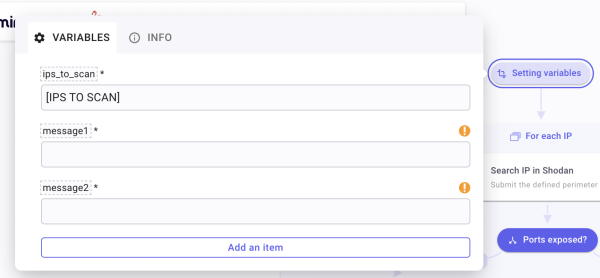
The last prep’ you can perform is setting up the different variables you will need throughout your Flow. Do so by creating a Transform Data (TD) that you will call Setting variables. Since we start with a predetermined set of IPs to analyze, you must create the first item by clicking Add an item. Name this item ips_to_scan. Fill in the field with the public IPs to scan as such ["IP 1","IP 2","IP 3",...]. After having done so, create 2 more items that you will name message1 and message2. Your variables are set.
Sending each IP to Shodan for port scanning and posting results
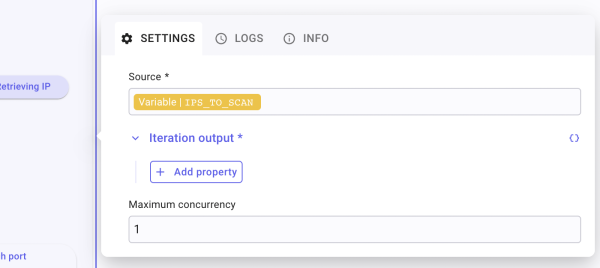
Right after your TD called Setting variables, create a For-each loop. Call it For each IP. To determine the source on which the loop will iterate, click on the gear icon in the bottom right of the For-each step. Once opened, under the “Source” field, type “/” to open the Data Picker feature.
Among the different choices, you will have to Pick ips_to_scan under VARIABLES. Doing so will set the For-each loop For each IP to iterate on the table we created earlier when we created the item ips_to_scan. We created a table that is now the source of the For-each loop. Your core loop configuration is set. Now, on to create steps inside.
First, create a Shodan step by clicking the “+” icon. Look for the Shodan actions either by navigating in the finder or directly by querying “Shodan ip”. Select the action get/shodan/host/{{ip}}. The Shodan step is created. Beware that you set the “On failure” to Continue playbook execution. Indeed, if you have no ports exposed, Shodan returns a 404.
Check that the Method is set to GET, and the URL should look like this: https://api.shodan.io/shodan/host/[IPS TO SCAN]. To configure the step, after host/, type “/” to open the Data picker and select For each IP under FLOW, then Iteration data. Once done as such, each iteration of the loop will query Shodan with the current iteration data from the table we submitted under the “Source” field when we configured the For-each loop. Run it once to generate execution logs.
After this step, create a condition that leads to two Transform Data. Call the condition Ports exposed? and the Transform Data Message1 output and Message2 output. Configure the first branch of the condition as such:
- Name the branch No ports exposed.
- Click the arrow on the right. Create a compare function.
- In the input field, type “/” and select the Shodan step. Select the test execution, then STATUS, then Pick
Code. - Select the operator
Contains. - Type 404 as comparator. We create this comparison because when Shodan finds no exposed ports for a queried IP, the service returns a 404 message. Creating this comparison helps us to acknowledge this public IP does not suffer opened ports.
For the second branch:
- Name the branch Ports exposed.
- Click the arrow on the right. Create a compare function.
- In the input field, type “/” and select the Shodan step. Select the test execution, then STATUS, then Pick
Code. - Select the operator
Contains. - Type 200 as comparator. When Shodan finds opened ports on an IP, the service will return a 200 code. This will help us triage between IPs to have particular attention on and IPs that don’t suffer opened ports on the network (404).
Your condition is set. Now on to the two Transform Data. We will determine the messages to be written in case there are opened ports or when there aren’t.
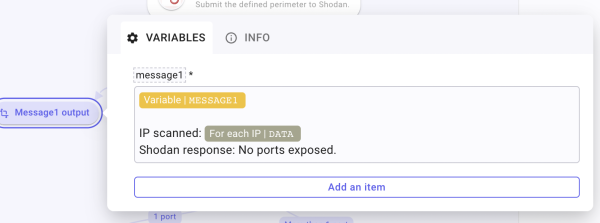
No ports exposed: Rename the Transform Data Message1 output. Then, in the body, type “/” to call message1 and then populate the field with the following items:
- IP scanned: "/" to select Iteration data inside For Each IP.
- Shodan's response: hard-type "No ports exposed".
When Ports are exposed, we want to determine if there is only 1 port or multiple ones. To do so, we will first retrieve the IP that has been analyzed to begin the formatting. Rename the Transform Data as Retrieving IP. Create the item message2 and inside, call message2 and type IP Scanned: “/” get the IP from the Shodan answer in the ip_str field.

After this, create a condition to determine if 1 or more ports are exposed. Create 2 branches, one leading to a Transform Data and one to a For-each loop.
- To the Transform Data: Name the branch 1 port. Inside, create a compare function. In input, Pick the table
data. Click on fx to apply a function. Click “Add a function” and search for Array length. Once created, go back and select the operator “Is lower or equal to” and then type “1”. - To the For-each: Name the branch More than 1 port. Perform the same tasks as the first branch BUT select the operator “Is greater than”. Type 1 as well.
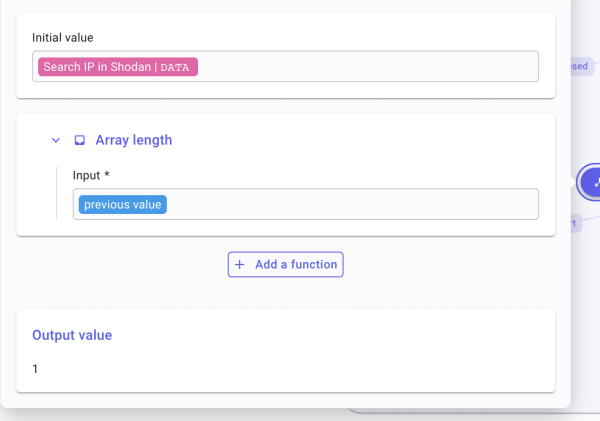
Comparison is set. Now, on to the TD and the For-each.
Configure the end of the 1 port branch by renaming the TD Message2 output. Inside, create message2 and call message2 and below, write “Port number:”, “Product:”, and “Protocol:”. Populate these lines by typing “/” for each one of them and Picking the corresponding field inside the Shodan response.
Configure the end of the More than 1 port branch by calling the For-each For each port. Set the Source of the loop by Picking the Shodan answer in the table data. Once the loop is set up, create a TD inside and name it… message2! Create the item message2 and, inside, call message2 and then populate the field just as the other Message2 output, with “Port number:”, “Product:”, and “Protocol:”.
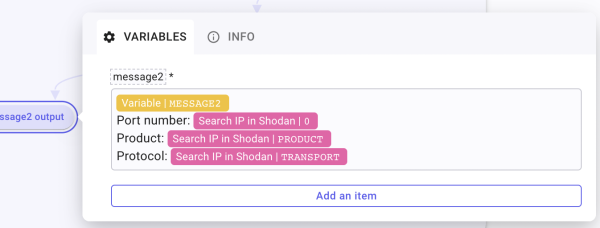
For each port is set. For each IP is set.
Now, quickly create your Slack action by adding a new step and looking for chat_postMessage. When the step is created, fill in your channelid and the Text field as such “Here is your ports scan report for last login IPs at Mindflow: – The following IPs have ports exposed:[call message2] – These IPs have no ports exposed: [call message1].
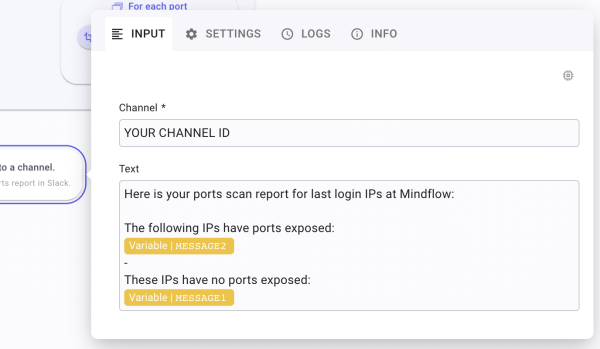
Et voilà!
Additional steps following port scanning
This port scanning Flow can be augmented to automate the process further. You can improve the Flow in two ways: automating gathering public IPs to analyze or Enforcing remediation upon findings.
Automating the public IP gathering.
Through your Work suite, your EDR, or your network control tool. You can get a user/device’s last login IP to submit to Shodan. Let’s look at what a port scanning Flow with this could look like by using Google Workspace to get the last log-in public IP.
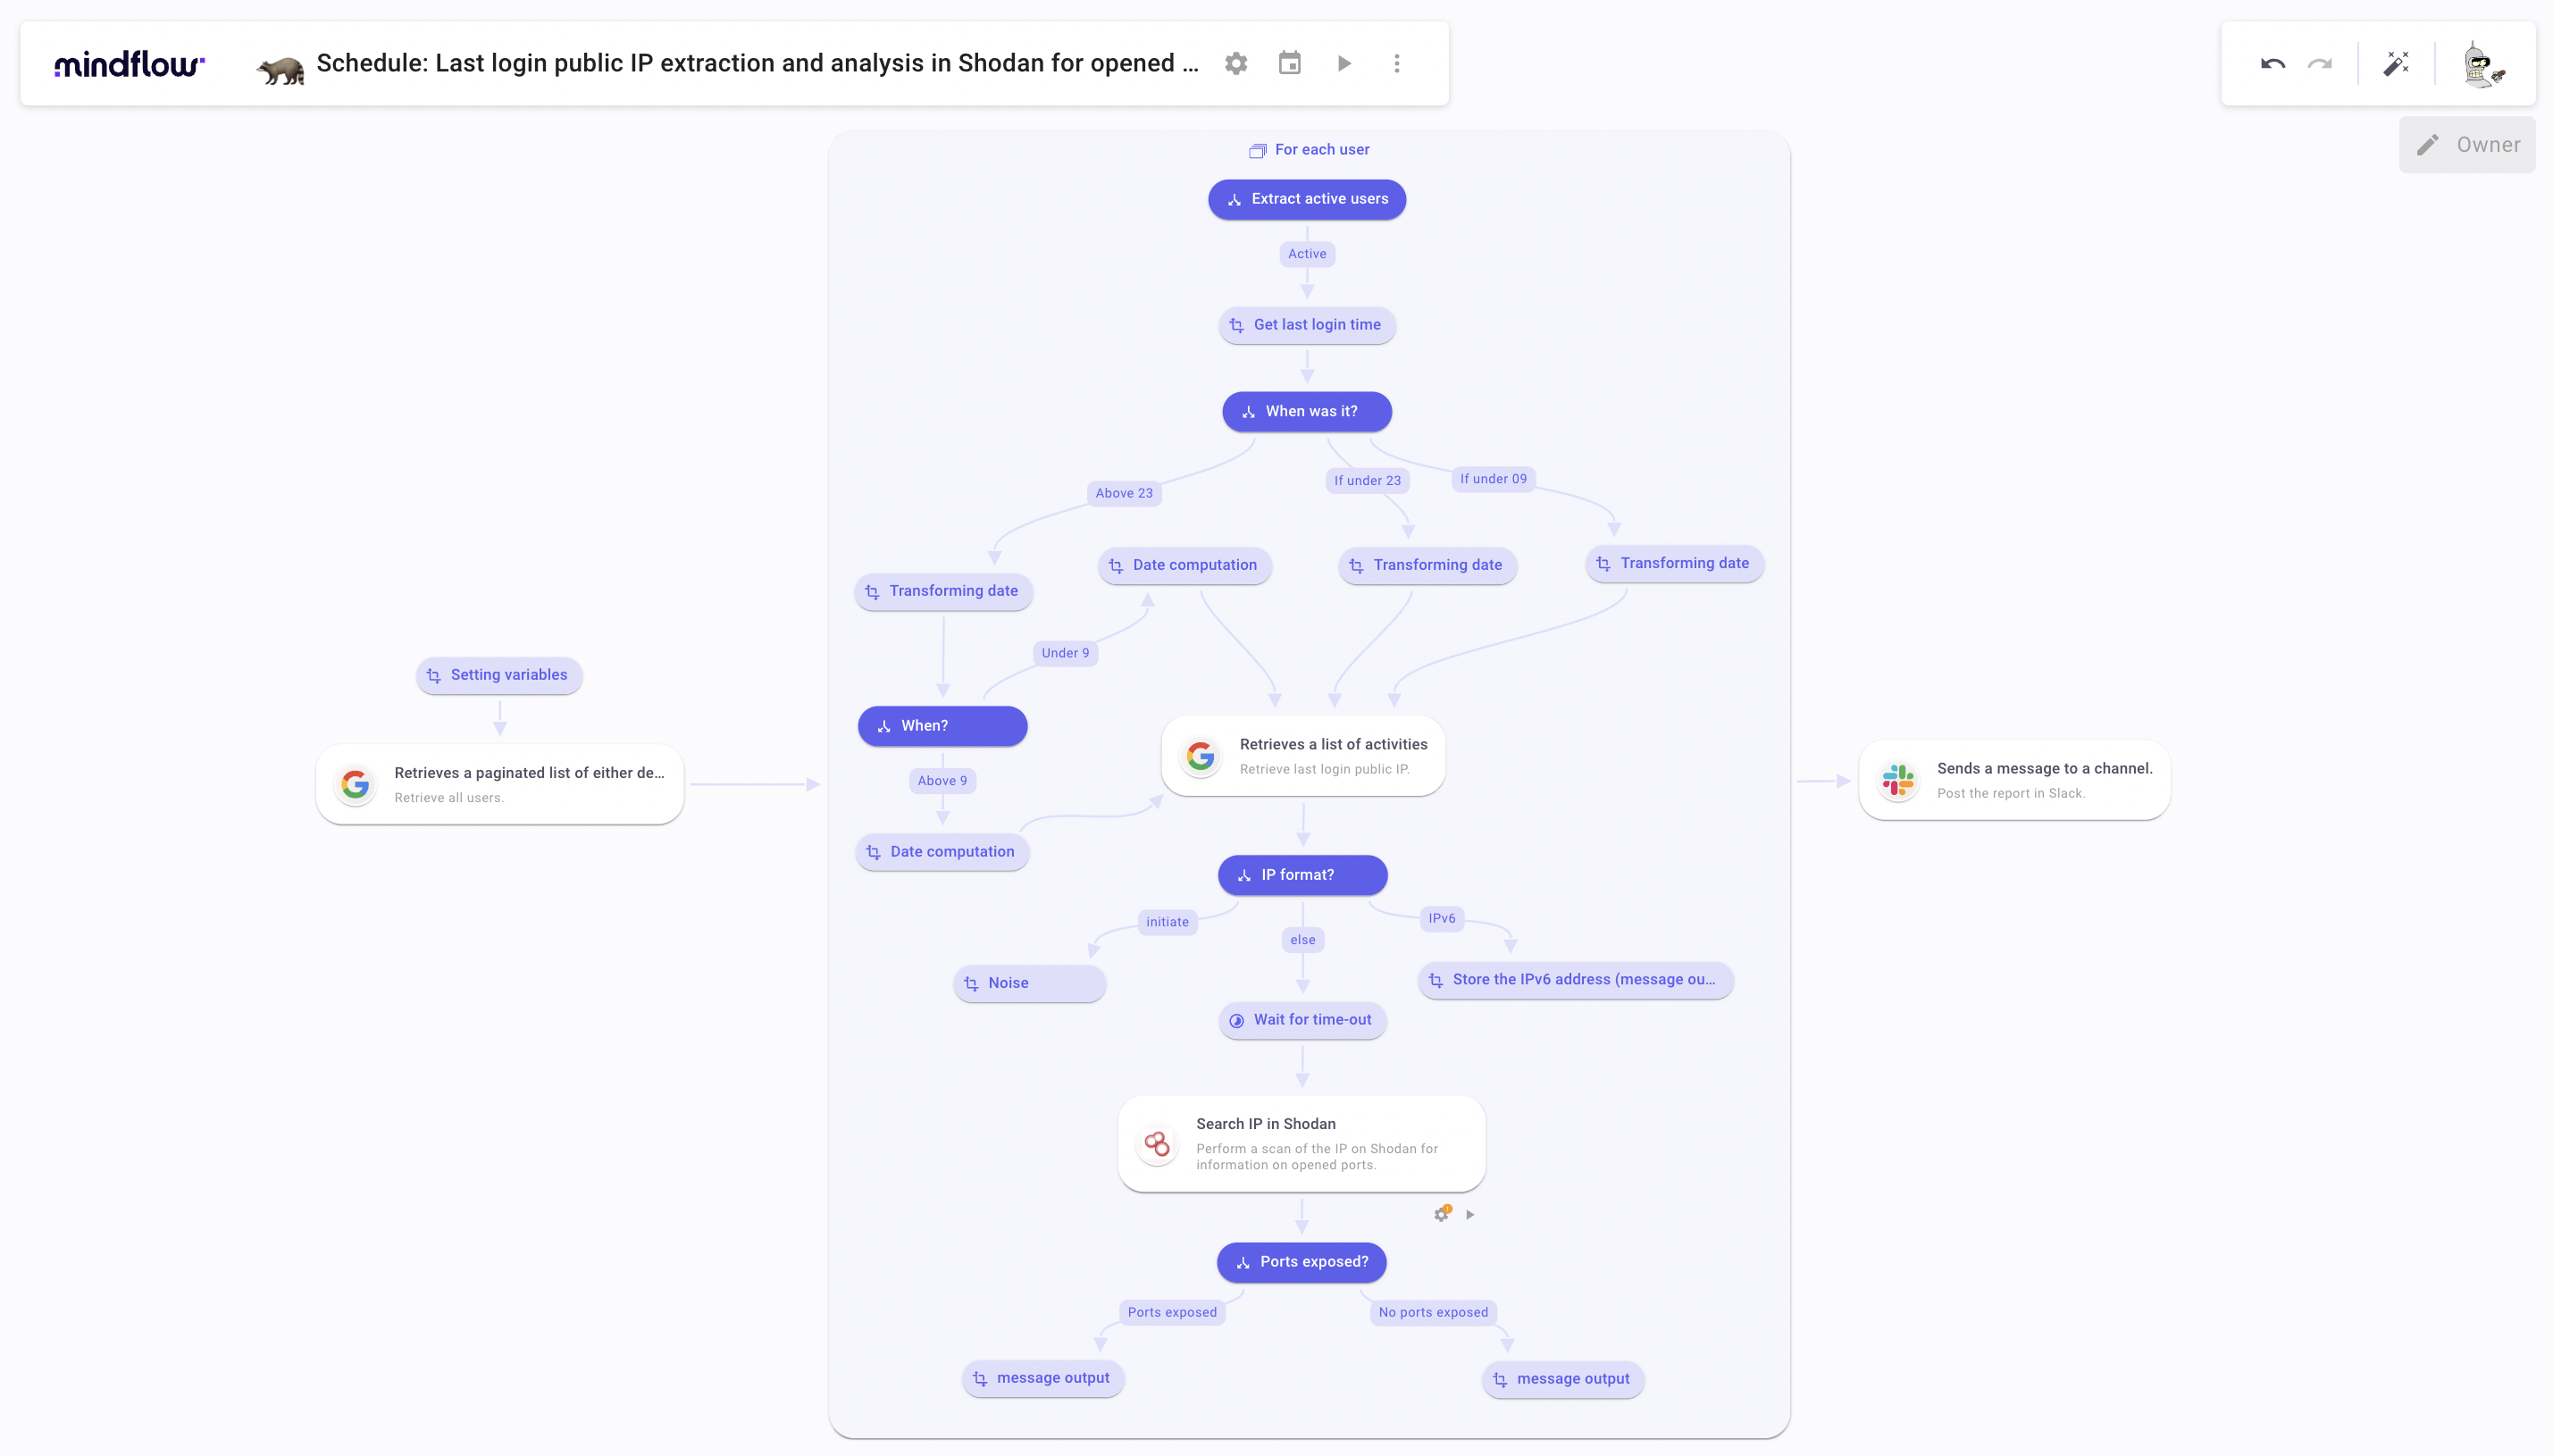
Take action on the port scanning results.
Update web control on the device through the EDR (SentinelOne, Sophos, etc.) by blocking ports comprised in your port scanning report. Upon alerts, you can also block specific networks to be connected to through your MDM.


